PRISMA flow diagram examples, with the numbers explained
Follow the count at each stage, then load the same example into the editor. These fictional examples explain the arithmetic; they are not findings from published reviews.
Fictional teaching data. All five examples use the same database-search trail so you can see what changes when another branch or a previous review is added. The examples have no ongoing or awaiting-classification reports.
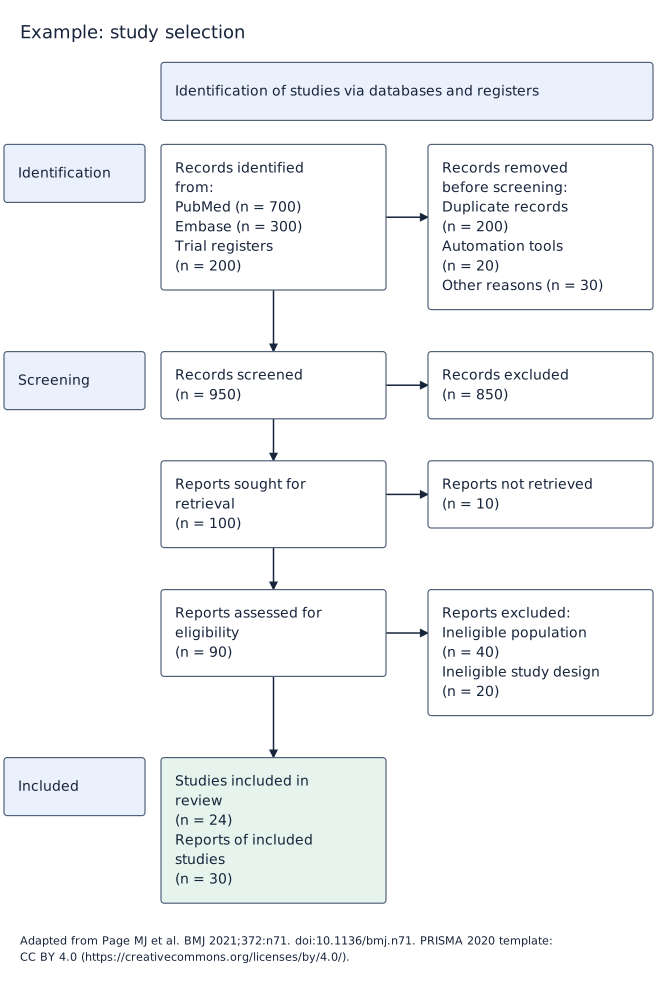
1. New review · databases
A new systematic review using databases and registers.
| Stage | Count | How it is accounted for |
|---|---|---|
| Identified | 1,200 | PubMed: 700; Embase: 300; Trial registers: 200 |
| Removed before the next stage | 250 | 200 duplicates; 20 by automation; 30 for other reasons |
| Records screened | 950 | 1,200 − 200 − 20 − 30 |
| Records excluded at screening | 850 | Title / abstract decisions |
| Reports sought for retrieval | 100 | 950 screened − 850 excluded; no record-to-report adjustment |
| Reports not retrieved | 10 | Not assessed for eligibility |
| Reports assessed for eligibility | 90 | 100 sought − 10 not retrieved |
| Excluded after assessment | 60 | Ineligible population: 40; Ineligible study design: 20 |
| Included reports from this branch | 30 | 90 assessed − 60 excluded |
The current search contributes 30 reports linked to 24 studies. Different report and study counts are expected when some studies have more than one report.
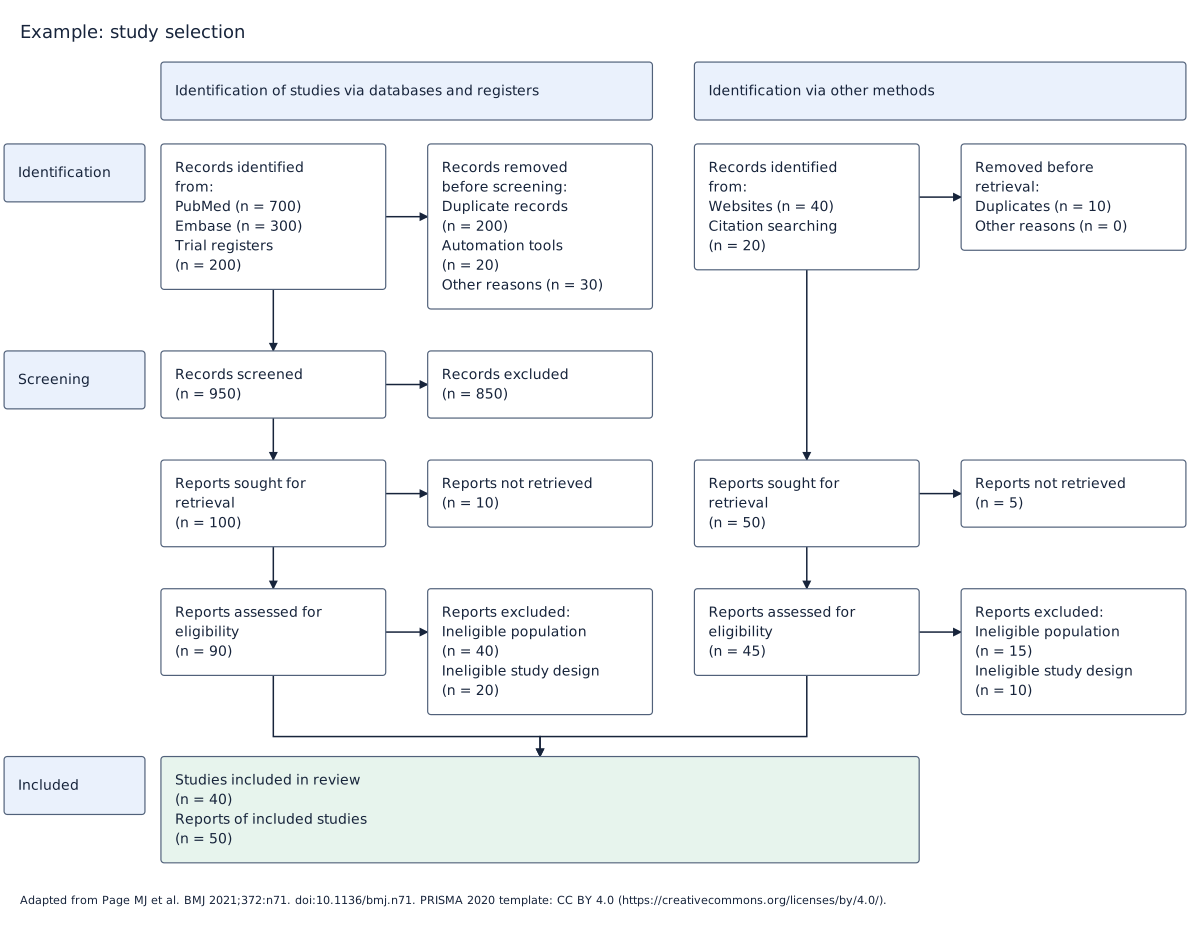
2. New review · all sources
Databases and registers, plus websites, organisations or citation searching.
| Stage | Count | How it is accounted for |
|---|---|---|
| Identified | 1,200 | PubMed: 700; Embase: 300; Trial registers: 200 |
| Removed before the next stage | 250 | 200 duplicates; 20 by automation; 30 for other reasons |
| Records screened | 950 | 1,200 − 200 − 20 − 30 |
| Records excluded at screening | 850 | Title / abstract decisions |
| Reports sought for retrieval | 100 | 950 screened − 850 excluded; no record-to-report adjustment |
| Reports not retrieved | 10 | Not assessed for eligibility |
| Reports assessed for eligibility | 90 | 100 sought − 10 not retrieved |
| Excluded after assessment | 60 | Ineligible population: 40; Ineligible study design: 20 |
| Included reports from this branch | 30 | 90 assessed − 60 excluded |
| Stage | Count | How it is accounted for |
|---|---|---|
| Identified | 60 | Websites: 40; Citation searching: 20 |
| Removed before the next stage | 10 | 10 duplicates; 0 by automation; 0 for other reasons |
| Reports sought for retrieval | 50 | 60 identified − 10 duplicates |
| Reports not retrieved | 5 | Not assessed for eligibility |
| Reports assessed for eligibility | 45 | 50 sought − 5 not retrieved |
| Excluded after assessment | 25 | Ineligible population: 15; Ineligible study design: 10 |
| Included reports from this branch | 20 | 45 assessed − 25 excluded |
The branches contribute 30 + 20 = 50 included reports. This example has zero remaining overlap between branches; duplicates have already been removed. The linked evidence represents 40 studies.
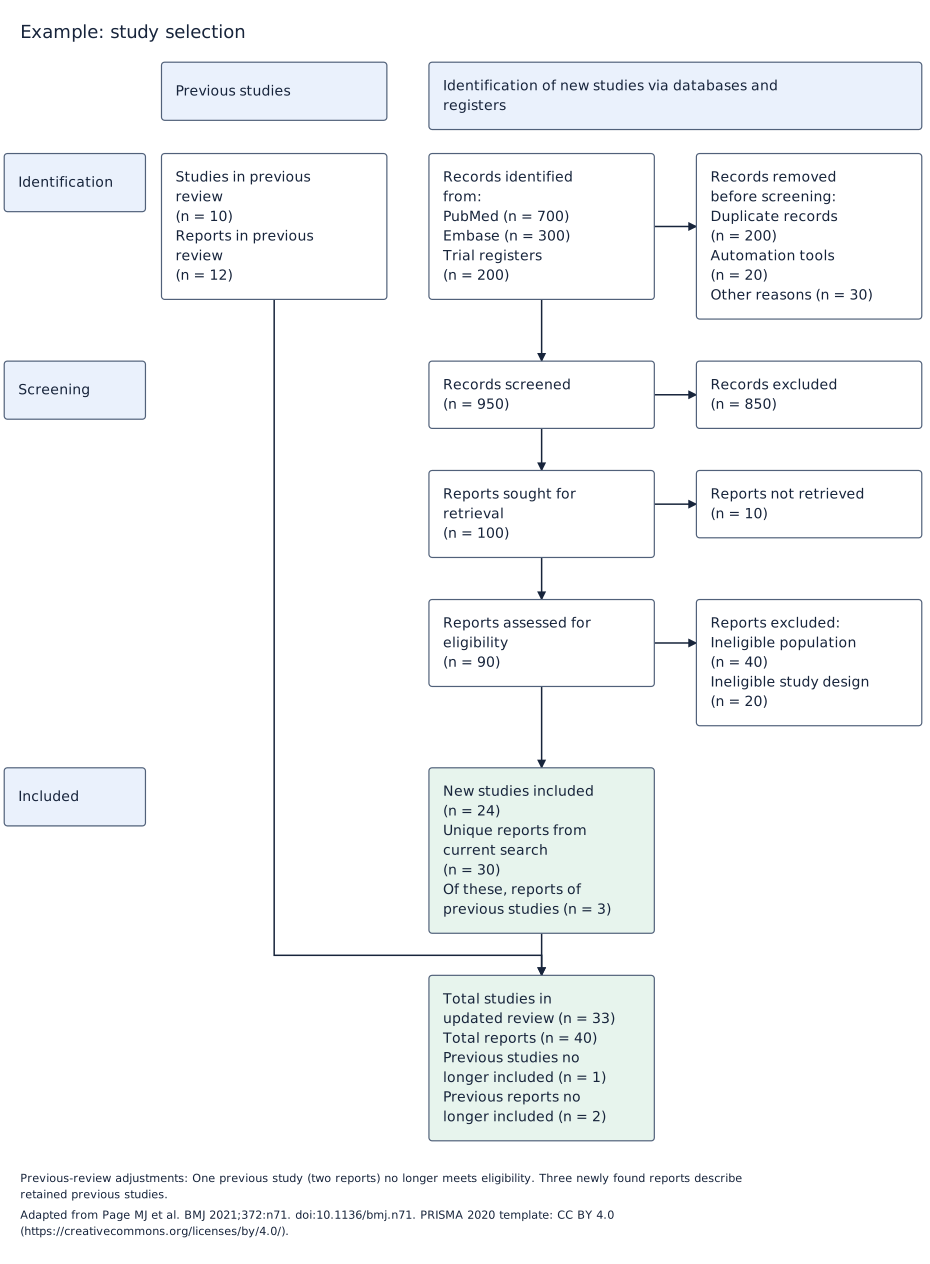
3. Updated review · databases
An update with a separate previous-review arm.
| Stage | Count | How it is accounted for |
|---|---|---|
| Identified | 1,200 | PubMed: 700; Embase: 300; Trial registers: 200 |
| Removed before the next stage | 250 | 200 duplicates; 20 by automation; 30 for other reasons |
| Records screened | 950 | 1,200 − 200 − 20 − 30 |
| Records excluded at screening | 850 | Title / abstract decisions |
| Reports sought for retrieval | 100 | 950 screened − 850 excluded; no record-to-report adjustment |
| Reports not retrieved | 10 | Not assessed for eligibility |
| Reports assessed for eligibility | 90 | 100 sought − 10 not retrieved |
| Excluded after assessment | 60 | Ineligible population: 40; Ineligible study design: 20 |
| Included reports from this branch | 30 | 90 assessed − 60 excluded |
The current search contributes 30 reports and 24 newly included studies; some current reports also describe retained previous studies. Different report and study counts are expected when some studies have more than one report.
The previous review contained 10 studies and 12 reports. One previous study, represented by two reports, no longer meets eligibility. The update therefore retains 9 studies and 10 reports.
Final study count: 10 − 1 + 24 = 33. Final report count: 12 − 2 + 30 = 40.
Here, 24 is the count of newly included studies. Three of the current 30 reports describe retained previous studies. Those three reports are already a subset of the current report total; do not add them again or count them as three new studies. The study-to-report links need to be checked in the review log.
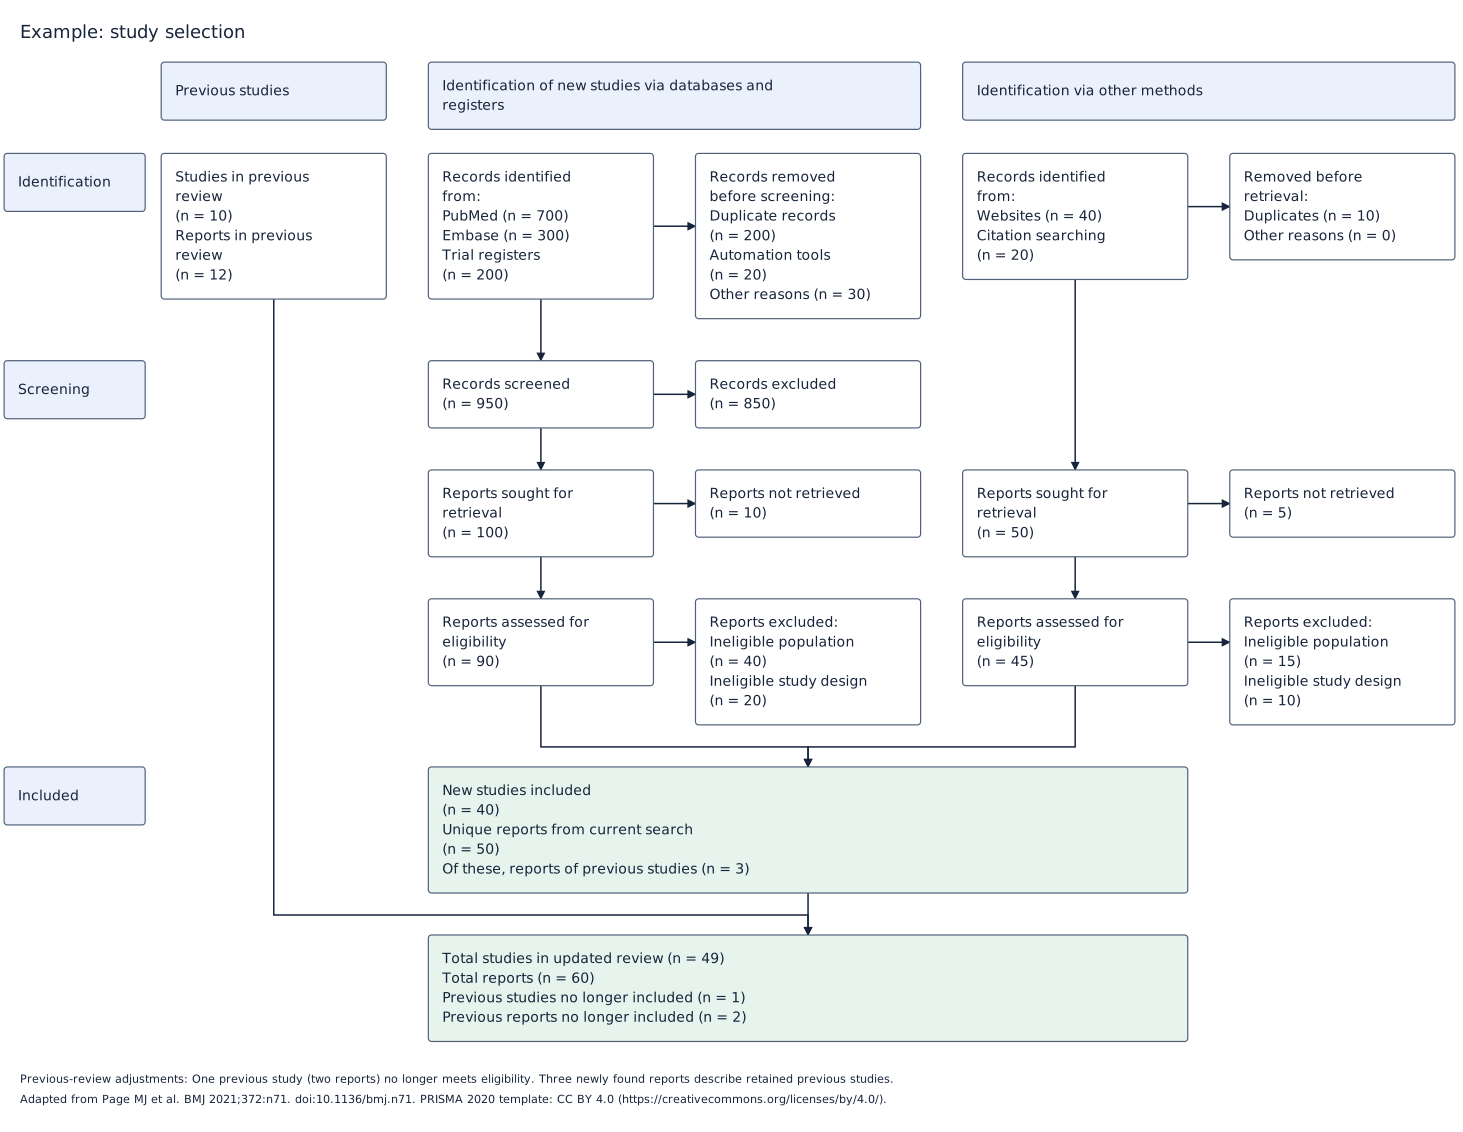
4. Updated review · all sources
Previous studies, a new database search and other sources.
| Stage | Count | How it is accounted for |
|---|---|---|
| Identified | 1,200 | PubMed: 700; Embase: 300; Trial registers: 200 |
| Removed before the next stage | 250 | 200 duplicates; 20 by automation; 30 for other reasons |
| Records screened | 950 | 1,200 − 200 − 20 − 30 |
| Records excluded at screening | 850 | Title / abstract decisions |
| Reports sought for retrieval | 100 | 950 screened − 850 excluded; no record-to-report adjustment |
| Reports not retrieved | 10 | Not assessed for eligibility |
| Reports assessed for eligibility | 90 | 100 sought − 10 not retrieved |
| Excluded after assessment | 60 | Ineligible population: 40; Ineligible study design: 20 |
| Included reports from this branch | 30 | 90 assessed − 60 excluded |
| Stage | Count | How it is accounted for |
|---|---|---|
| Identified | 60 | Websites: 40; Citation searching: 20 |
| Removed before the next stage | 10 | 10 duplicates; 0 by automation; 0 for other reasons |
| Reports sought for retrieval | 50 | 60 identified − 10 duplicates |
| Reports not retrieved | 5 | Not assessed for eligibility |
| Reports assessed for eligibility | 45 | 50 sought − 5 not retrieved |
| Excluded after assessment | 25 | Ineligible population: 15; Ineligible study design: 10 |
| Included reports from this branch | 20 | 45 assessed − 25 excluded |
The branches contribute 30 + 20 = 50 included reports. This example has zero remaining overlap between branches; duplicates have already been removed. The current search adds 40 newly included studies; some current reports also describe retained previous studies.
The previous review contained 10 studies and 12 reports. One previous study, represented by two reports, no longer meets eligibility. The update therefore retains 9 studies and 10 reports.
Final study count: 10 − 1 + 40 = 49. Final report count: 12 − 2 + 50 = 60.
Here, 40 is the count of newly included studies. Three of the current 50 reports describe retained previous studies. Those three reports are already a subset of the current report total; do not add them again or count them as three new studies. The study-to-report links need to be checked in the review log.
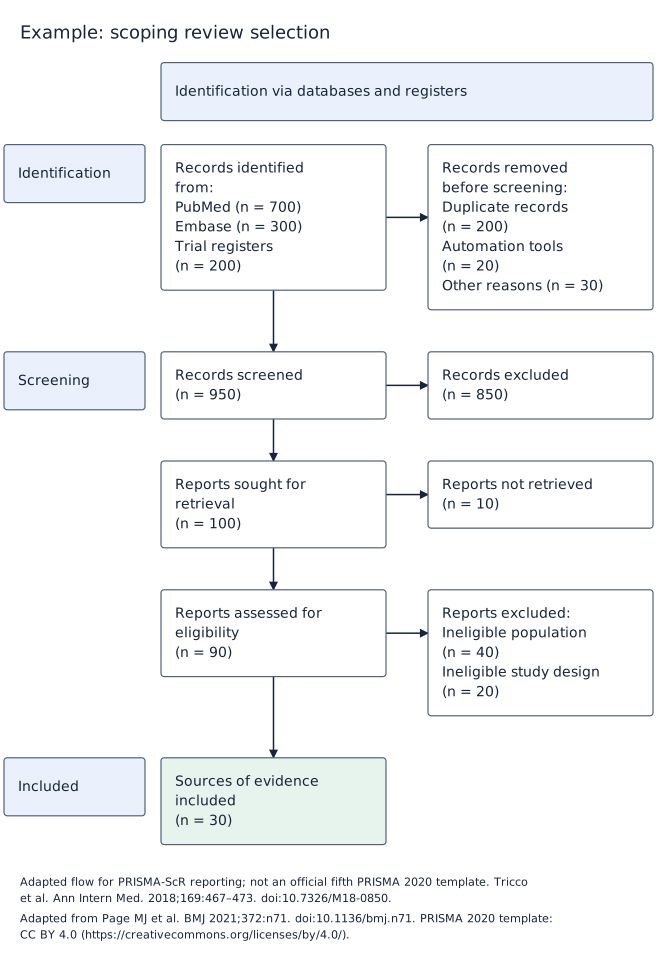
5. Scoping review · PRISMA-ScR
The ScR adaptation uses the selection stages to track evidence sources. Read these counts alongside the kinds of evidence your protocol allows.
| Stage | Count | How it is accounted for |
|---|---|---|
| Identified | 1,200 | PubMed: 700; Embase: 300; Trial registers: 200 |
| Removed before the next stage | 250 | 200 duplicates; 20 by automation; 30 for other reasons |
| Records screened | 950 | 1,200 − 200 − 20 − 30 |
| Records excluded at screening | 850 | Title / abstract decisions |
| Sources sought for retrieval | 100 | 950 screened − 850 excluded; no record-to-report adjustment |
| Sources not retrieved | 10 | Not assessed for eligibility |
| Sources assessed for eligibility | 90 | 100 sought − 10 not retrieved |
| Excluded after assessment | 60 | Ineligible population: 40; Ineligible study design: 20 |
| Included sources of evidence | 30 | 90 assessed − 60 excluded |
Outcome: 30 sources of evidence. These could include different evidence types if eligible under the scoping-review protocol. There is no requirement to turn this count into a meta-analysis total.
An error example: 10 records too many
After identifying 1,200 records, this log removes 200 duplicates, 20 records by automation and 30 for other reasons. The next stage must account for 950 screened records: 1,200 − 200 − 20 − 30 = 950.
If the diagram says 960, it contains 10 records too many at that stage. Check whether the identified total, removal categories or screened total was copied incorrectly. A balancing change without a supporting log entry hides the problem.
A second frequent mistake is to call 10 unavailable full texts “excluded after assessment.” If 100 reports were sought and 10 were not retrieved, 90 were assessed. Only decisions about those 90 reports belong in the eligibility-exclusion reasons.
Sources and attribution
Journal Metrics provides an independent implementation of the PRISMA flow diagram. The original PRISMA 2020 templates are available under CC BY 4.0. Our editor adapts their layout and adds count checks; it is not endorsed by the PRISMA group.
- Page MJ, McKenzie JE, Bossuyt PM, et al. The PRISMA 2020 statement: an updated guideline for reporting systematic reviews. BMJ. 2021;372:n71.
- Page MJ, Moher D, Bossuyt PM, et al. PRISMA 2020 explanation and elaboration. BMJ. 2021;372:n160.
- Official PRISMA 2020 checklist and expanded checklist — use these to review the full manuscript.
- Tricco AC, Lillie E, Zarin W, et al. PRISMA extension for scoping reviews (PRISMA-ScR): checklist and explanation. Ann Intern Med. 2018;169:467–473. See the official ScR checklist.
Content updated October 13, 2026. Count examples are illustrative.